




















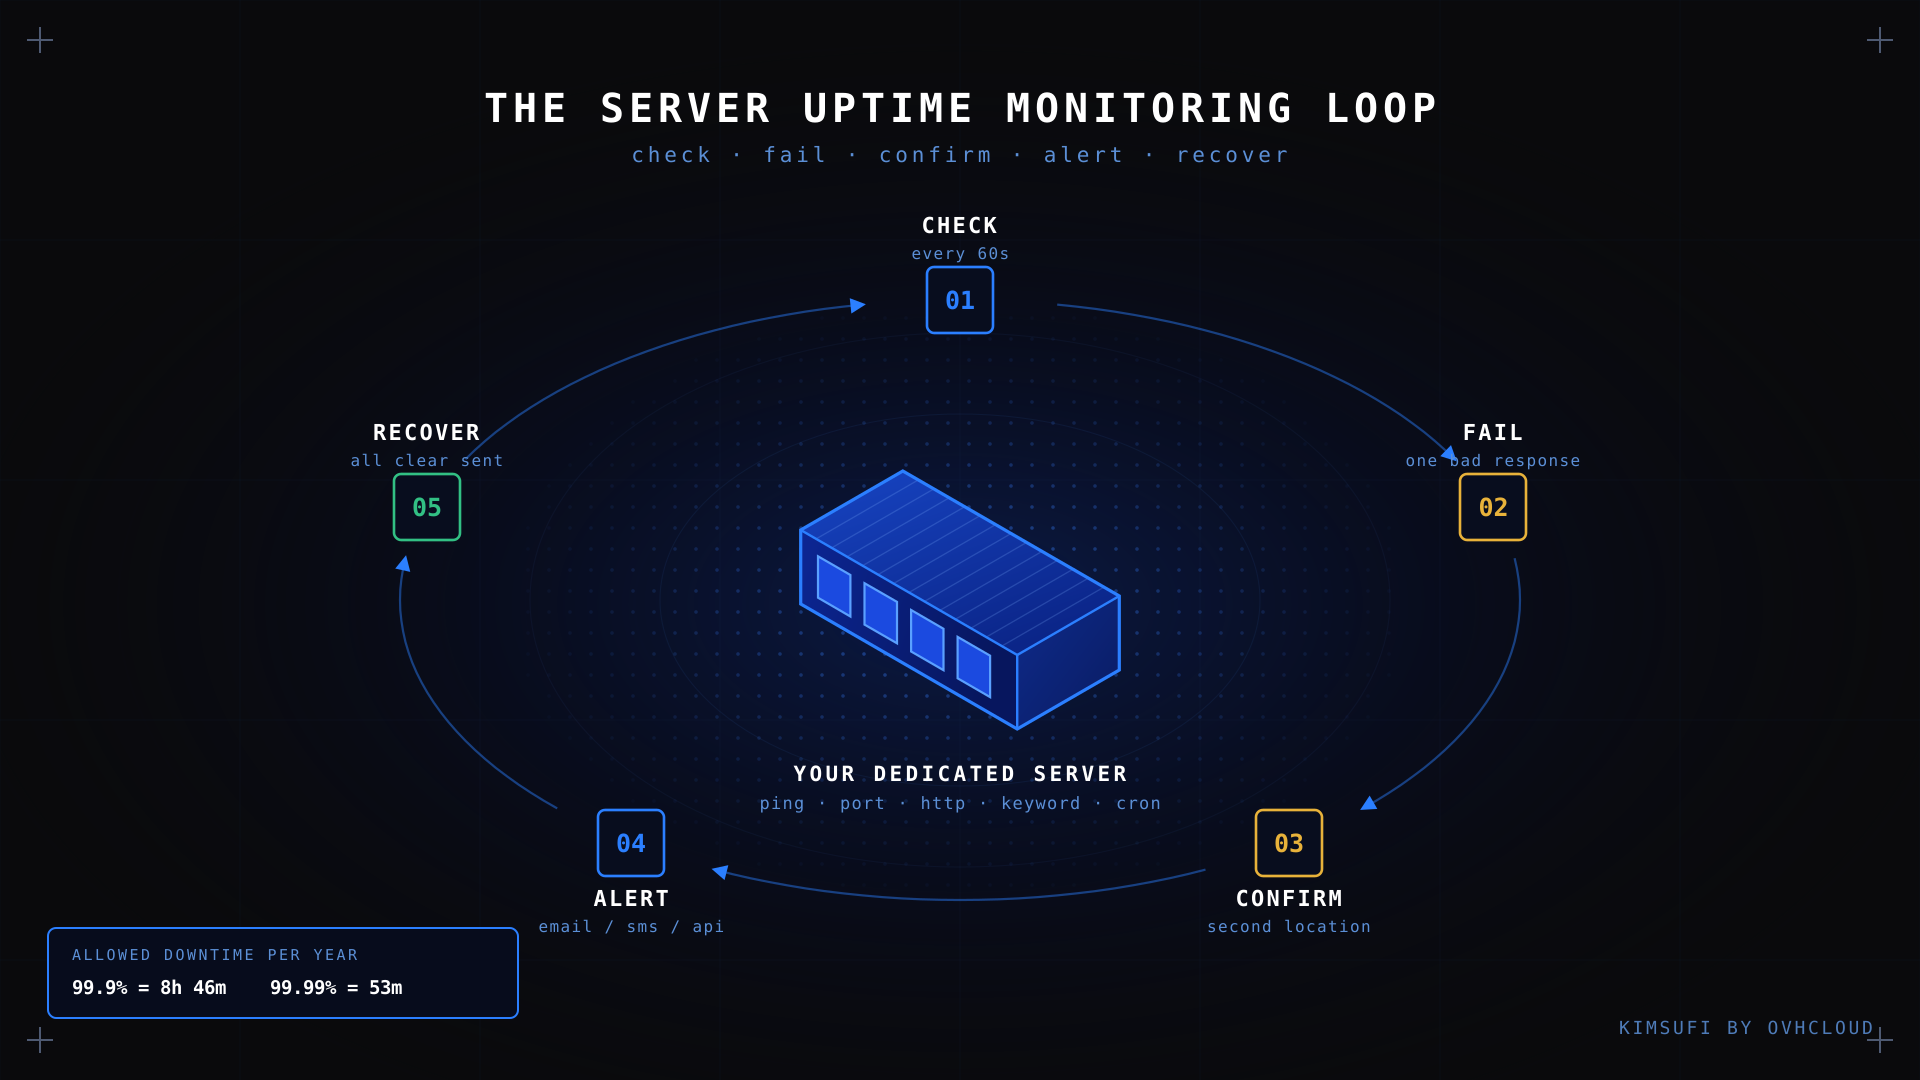
Server uptime is the share of time your machine stays reachable and working, and to monitor server uptime means testing it automatically so you hear about an outage before your users do. An hour offline costs real money, yet plenty of small teams still find out by accident. This guide covers the five methods, the alerts that reach you, and what we run on dedicated servers daily.
Key takeaways
- A server uptime monitor tests your machine at a fixed interval, usually every 60 seconds to 5 minutes, and alerts you when a test fails.
- The five monitor types are ping, port, HTTP(S), keyword and cron. Each catches a different failure.
- Monitor alerts should land where you look: email, SMS, Slack, PagerDuty or a webhook.
- A public status page and dashboard turn downtime into transparent communication, not a flooded inbox.
- On a dedicated server, availability checks also cover hardware: disk, load and network health.
What is server uptime (and why monitor it)?
Server uptime is the percentage of time a server is powered on, reachable, and answering requests correctly. It is measured monthly or yearly, so 99.9% allows a little under nine hours of unavailability per year. That figure blends two things: availability asks whether the machine responds at all, performance asks how fast.
Cost is what makes automation worth it. In the Uptime Institute's Annual Outage Analysis 2026, 57% of operators surveyed said their last major outage passed $100,000. Those are data centre figures, but the direction holds.
How does a server uptime monitor work?
A server uptime monitor runs one process on a loop. An agent contacts your endpoint on a schedule and compares the response against a threshold you set. One failure rarely means an outage, so a good cloud-hosted service confirms from a second location before waking anyone. That confirmation process separates a useful tool from a noisy one.
Once confirmed, alerts go out and testing continues until the recovery process completes. Then the process repeats. Pause checks during a planned maintenance window, and keep a maintenance calendar so a reboot never starts an escalation process at 3am.
The 5 monitoring methods compared
Each monitor type catches what the others miss, so one test is rarely enough.
Ping
Sends an ICMP echo request and waits for a reply. Proves the host is powered on and routable, nothing more, and fails first in a network incident.
Port
Opens a TCP connection to one service: 22 for SSH, 3306 for MySQL, 25565 for a game server. Catches the case where the machine is fine but the daemon died.
HTTP(S)
Requests a URL and inspects the status code and response time. The closest proxy for what a visitor sees, and it catches 500s and slow pages that ICMP never will.
Keyword
Fetches a page and searches for a string you expect. A broken application often returns 200 with an error page, so if "Add to basket" disappears, something is wrong.
Cron job
Inverts the model: your scheduled task calls a URL when it finishes, and an alert fires if that call never arrives. The only method that catches a silently stopped backup.
| Method | Detects | Interval | Best for |
|---|---|---|---|
| Ping (ICMP) | Host down, packet loss | 1 min | Network reachability |
| Port (TCP) | Service not listening | 1 min | SSH, databases, game servers |
| HTTP(S) | Error codes, poor performance | 1 min | Websites and APIs |
| Keyword | Right code, wrong content | 5 min | Dynamic pages, checkout |
| Cron (heartbeat) | A job that never ran | Job schedule | Backups, batch processes |
How to monitor server uptime in 5 steps
- Pick endpoints and monitor type. Start with the public URL and the port that matters most. Two good tests beat twenty noisy ones.
- Set the interval. 60 seconds for customer-facing work, 5 minutes for internal tools.
- Configure the threshold. Require two or three consecutive failed checks, and add a response-time limit so degradation surfaces early.
- Connect your channels. Point the server uptime monitor at email plus one channel you cannot ignore, then enable escalation.
- Publish a status page. It cuts support volume and ensures customers are not guessing.
Alerts and integrations: get notified where you work
An alert nobody reads is not an alert. Email is the baseline, so enable SMS for the small hours and Slack to keep the team in one thread. PagerDuty adds rotas and acknowledgement on one dashboard, which ensures an incident cannot sit unclaimed. A webhook pushes events into your own dashboard.
Two ways to tighten the process and cut false alarms. Enable multi-location confirmation, so one unlucky route does not page you. And separate synthetic tests from real-user data: synthetic runs from a cloud region you pick, while real-user data reflects the performance actual visitors get. Running both gives a clean signal and honest context.
Server uptime SLAs explained: 99.9% vs 99.999%
Every extra nine costs real engineering. The arithmetic behind common availability targets:
| Server uptime | Allowed downtime per year | Per month |
|---|---|---|
| 99% | 3 days 15 hours | 7 hours 12 minutes |
| 99.9% | 8 hours 46 minutes | 43 minutes |
| 99.95% | 4 hours 23 minutes | 22 minutes |
| 99.99% | 53 minutes | 4 minutes 19 seconds |
| 99.999% | 5 minutes 15 seconds | 26 seconds |
A cloud or hosting provider's SLA covers its own layer: power, network and hardware. It does not cover your application, your certificate or your disk. Closing that gap is your job, and a dedicated server you fully control means owning the software side of availability.
Troubleshooting common downtime scenarios
| Symptom | Likely cause | First move |
|---|---|---|
| Host replies, port test fails | Service crashed or stopped listening | Restart the unit, read its journal |
| HTTP 500 after a deploy | Bad release or unfinished migration | Roll back, read application logs |
| Slow, then unreachable | Disk full or a runaway process | Free disk space, enable log rotation |
| Reachable from one region only | Routing or IP-level filtering | Retest from a second location |
| Sudden browser warnings | Expired TLS certificate | Renew, then automate renewal |
Disk full is the most common server uptime killer. Our guide on how to prevent server downtime covers the routine behind it.
FAQ
How can I check the uptime of my server?
Run uptime or who -b over SSH to see how long the machine has been running. That says nothing about whether users can reach it, so pair it with a service that monitors server uptime from outside your network.
What does 99.999% uptime mean?
Roughly five minutes of unavailability per year, or 26 seconds a month. Reaching it needs redundant hardware, automatic failover and a team on call, so it is priced for critical infrastructure.
Can I set custom alert thresholds for downtime?
Yes. Most tools let you define how many consecutive failures trigger a notification, how long to wait between tests, and what response time counts as degraded. Two or three failures is a sensible default.
How do webhooks work with uptime alerts?
It is a URL you own. When a monitor alert fires, the service sends an HTTP POST with the incident details, and your endpoint decides what happens next: open a ticket or trigger a restart.
Is there a free tier for server uptime monitoring?
Most cloud services offer one, typically 50 tests at 5-minute frequency with email alerts. Free plans usually drop SMS, faster tests and status dashboards.
Wrap-up
Good server uptime monitoring is a few well-chosen tests, limits that suppress noise, and monitor alerts routed somewhere you will see them. Set it up once and server uptime stops being a guess.
Looking for a reliable server to monitor? Compare Kimsufi server plans from $11.10/month, with root access, unmetered bandwidth and built-in DDoS protection.